

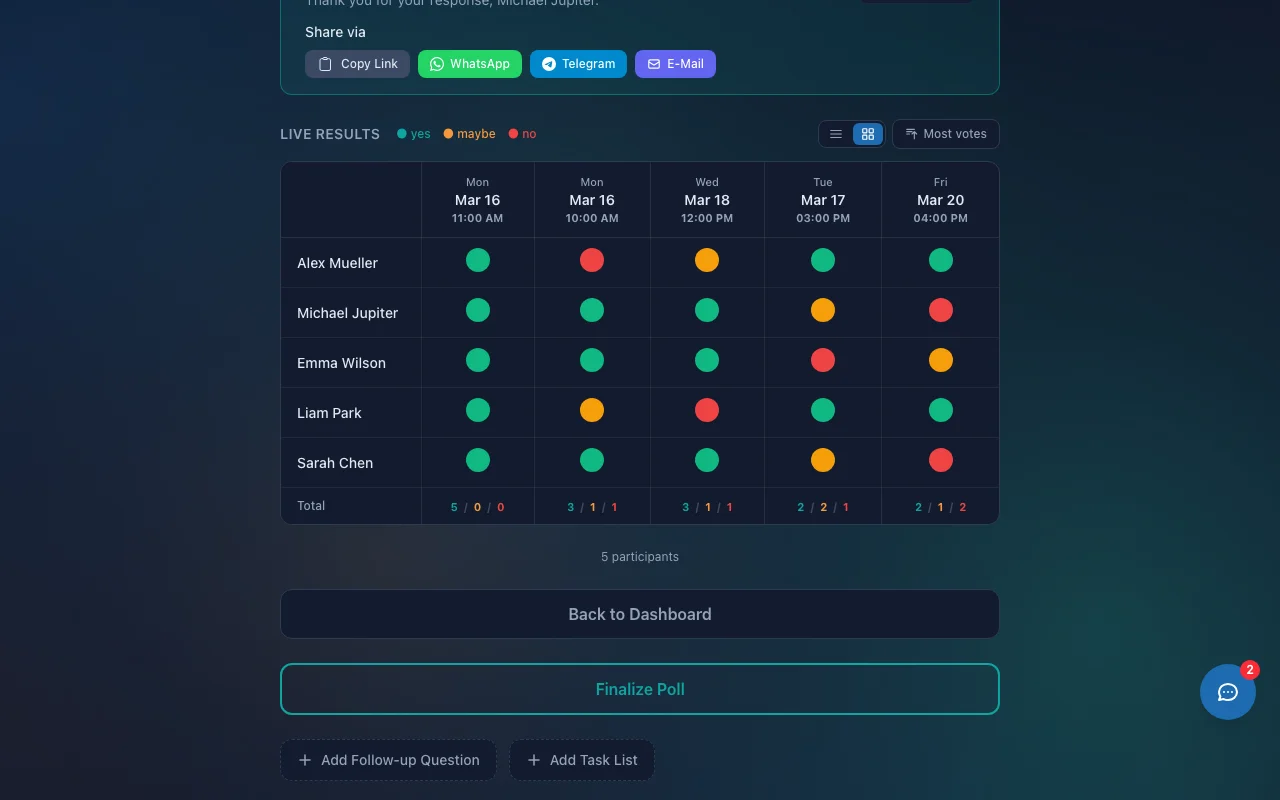
Poll results can now be displayed in a compact table view. Click the grid icon next to “Most votes” to switch between the card view and the new table.
What’s new?
- Colored dots show at a glance who voted Yes (green), Maybe (orange) or No (red)
- Hover tooltips display name, date and vote
- Summary row with Yes/Maybe/No counts per option
- Sticky name column stays visible when scrolling horizontally
- The view preference is saved in your browser for next time
Especially useful for polls with many options and participants, the grid view is much clearer than individual cards.
The grid view is one of the features that sets Timergy apart from Doodle and When2Meet.